 The RaySim6 Windows - Model View and Results View
The RaySim6 Windows - Model View and Results View
The RaySim6 Windows - Model View and Results ViewRaySim6 has two main viewing windows - Model View and Results View. The Model View has interactive features that allow you to build and edit Models and set up and run Batches of simulations. The Results View shows the results of tracing. The two views are shown below, with an explanation of the main areas of each view following. A third view, called Model Details View, and a fourth view, called Plot View, are presently under construction.
Document/Model View
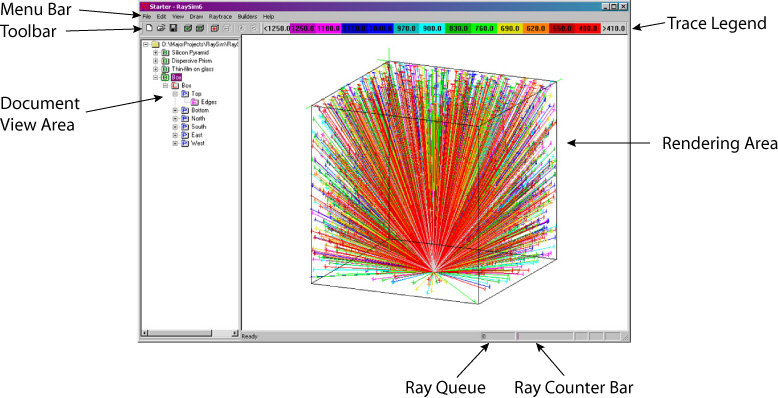
Menu Bar - All of the RaySim6 operations can be accessed through the main Menu Bar, including the View menu, which allows users to switch between the Document/Model View and the Results View.
![]()
Toolbar - Some of the Menu Bar commands are also on the Toolbar as shortcuts.
![]()
From left to right, the buttons activate the commands: New Document, Open Document, Save Document, Insert New Batch, Delete Current Batch, Insert New Layer, Delete Current Layer, Insert New Plane and Delete Current Plane.
Trace Legend Bar - The trace legend is a key that indicates the value of one of two particular properties that drawn rays have, either wavelength or intensity. The trace legend can be edited from the Draw/Color Scale menu. In this case, the trace legend references the wavelength of the rays drawn on the Rendering Area.
![]()
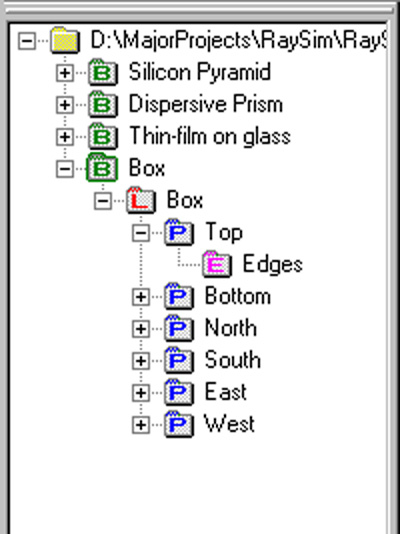
Document View Area - This collapsable tree control allows you to navigate through the Batches, Layers, Planes and Edges that make up your document. Batches are shown in green, Layers in red, Planes in blue and Edges in magenta. Left click the plus or minus boxes with the mouse to expand or collapse a particular node of the tree in order to show or hide child nodes of the tree. You will find this is a fast way to build and edit your Batches and Models. Double left click with the mouse on the particular Batch, Layer, Plane or Edges to edit the properties of that object. Single click on the name of a Batch, Layer, Plane or Edge to highlight that object in the rendering area.
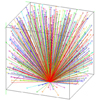
Rendering Area - RaySim6 will draw your Model in the Rendering Area as a stick-figure drawing, showing the edges of all planes. When a trace is in progress, it will also draw the traced rays on (over, actually) the Model, if the user has set the Draw/Draw on Raytrace check on the Menu Bar. The user can move and rotate the Model in pseudo 3D using the mouse or keyboard, and zoom the Model in/out using the keyboard. The user can also move and rotate the incident trace rays using the mouse or keyboard.
|
Model
Action
|
Mouse
|
Keyboard
|
|
Zoom
in / out
|
-
|
Press
i / o
|
|
Move
Model up / down, left / right
|
Hold
left mouse button, move mouse up / down, left / right
|
Arrow
Keys or Numpad 2,4,6,8
(I think) |
|
Rotate
Model in Azimuth (around z-axis)
|
Hold
right mouse button, move mouse left / right
|
I
forgot
|
|
Rotate
Model in Elevation (around x-y projection)
|
Hold
right mouse button, move mouse up / down
|
I
forgot
|
|
Re-center
a Model
|
Click
the mouse wheel
|
h
key or Home key
|
|
Ray
Action
|
Mouse
|
Keyboard
|
|
Move
Ray in x
|
Hold
left mouse button and shift button, move mouse up / down
|
Hold
shift button, Arrow Keys or Numpad 4 / 6
|
|
Move
Ray in y
|
Hold
left mouse button and shift button, move mouse left / right
|
Hold
shift button, Up / Down Arrow Keys or Numpad 2 / 8
|
|
Rotate
Ray in Azimuth (around z-axis)
|
Hold
right mouse button and shift button, move mouse left / right
|
I
forgot
|
|
Rotate
Ray in Elevation (around x-y projection)
|
Hold
right mouse button and shift button, move mouse up / down
|
Hold
shift button, Up / Down Arrow Keys or Numpad 2 / 8
|
Ray Stack and Ray Counter Bar - The Ray Queue panel shows the number of Rays in the trace LIFO stack. In the figure below, there are 13277 Rays in the trace LIFO stack. The Ray Counter Bar animates the accumulation of trace operations. When the bar fills completely and resets it self, another 1 million trace operations have been carried out.
![]()
Results View
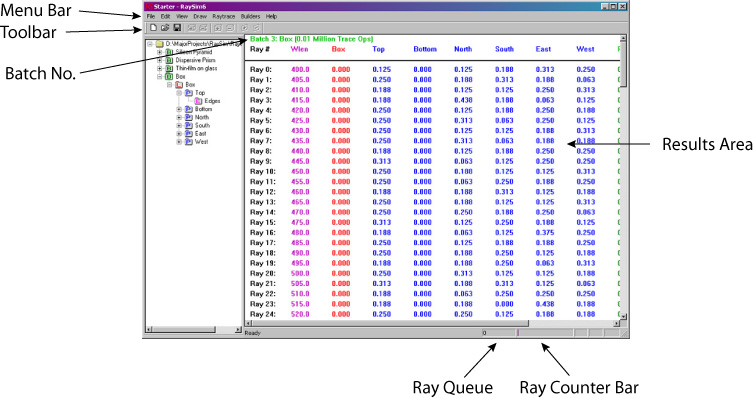
Results Area - The Results Area can be accessed from the View/Results menu. This view shows the results of a Batch trace - one row for each unique ray generated within the Model and one column for each Layer or Plane in the Model. The numerical information represents the intensity of light absorbed in or on the particular Layer or Plane indicated at the top of each column. The Remainder column shows the total intensity of light discarded by the simulator at the termination of the trace (not shown). The Lost column shows the total intensity of light lost from the Model (not shown). The Total column shows the total intensity of light absorbed in the Model, including the Remainder and the Lost intensities (not shown).